Quick answer: App Store Connect Analytics helps teams analyze impressions, product-page views, first-time downloads, conversion, acquisition sources, territories, devices, custom product pages, and product page optimization tests. Start with a precise business question, choose the correct dimension and denominator, annotate releases, and connect store outcomes to subscription, sales, and product-quality signals.
What this guide will help you do
This guide focuses on App Store Connect Analytics with a practical, evidence-led approach. It covers App Analytics ASO, iOS conversion analytics, App Store metrics without repeating phrases for artificial density. Use the framework to make a clear decision, document the result, and improve the next release.
Ask one question per view
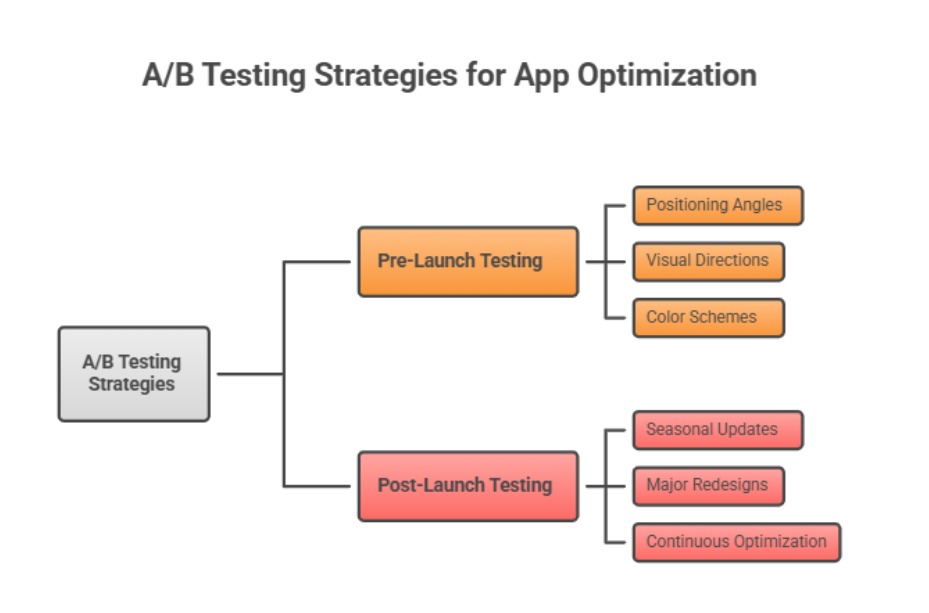
Examples include: which territories lost conversion after the release, which CPP brings the highest-value users, or whether a PPO treatment produced meaningful incremental downloads. A question determines the metric, segment, and date range.
Confirm whether the analysis uses impressions, page views, downloads, or conversion and whether it covers first-time downloads. Differences in denominators can reverse a conclusion.
Use acquisition dimensions
Compare source type, territory, device, app version, and product-page context. Apple states CPP analytics can include page views, downloads, conversion, subscriptions, and sales, with data appearing once a page has at least five first-time downloads.
For PPO, evaluate the reported treatment analysis and confidence, then check absolute value and downstream behavior before applying a result.
Create an annotated operating cadence
Maintain a timeline of metadata, creative, product, price, campaign, featuring, outage, and seasonal changes. Review risks daily when needed, experiments when evidence is ready, and the full funnel on a stable weekly or monthly cadence.
Export or connect reports for governed analysis, reconcile them with internal analytics, and document differences instead of forcing totals to match.
Action plan
- Start with a decision question
- Confirm metric definitions
- Segment by territory and source
- Annotate every material change
- Connect downloads to value
- Document data thresholds and latency
Metrics to monitor
- Impressions and product-page views
- First-time downloads and conversion
- CPP and PPO performance
- Subscriptions, sales, retention, and quality
Record the baseline, release date, audience, markets, and external changes before interpreting movement. Rankings and conversion are useful signals, but a decision is stronger when activation, retention, and business value confirm that the page attracted the right users.
Continue the topic cluster
Use these supporting resources to move from this strategy into the next implementation step:
- ASO KPIs: The Metrics That Connect Visibility to Revenue
- Apple Product Page Optimization: Design Tests You Can Trust
- Custom Product Pages on iOS: Match Every Campaign to Its Intent
- ASO Audit Checklist: Find the Highest-Impact Growth Constraint
- App store optimization services
Frequently asked questions
Why do App Store analytics and internal analytics differ?
They may use different attribution, privacy, identity, time, and event definitions. Reconcile methodology before treating either total as wrong.
When does custom product page data appear?
Apple currently states that data for a CPP appears after it receives at least five first-time downloads.
Primary sources
Platform capabilities and limits can change. Verify current requirements in these official resources: